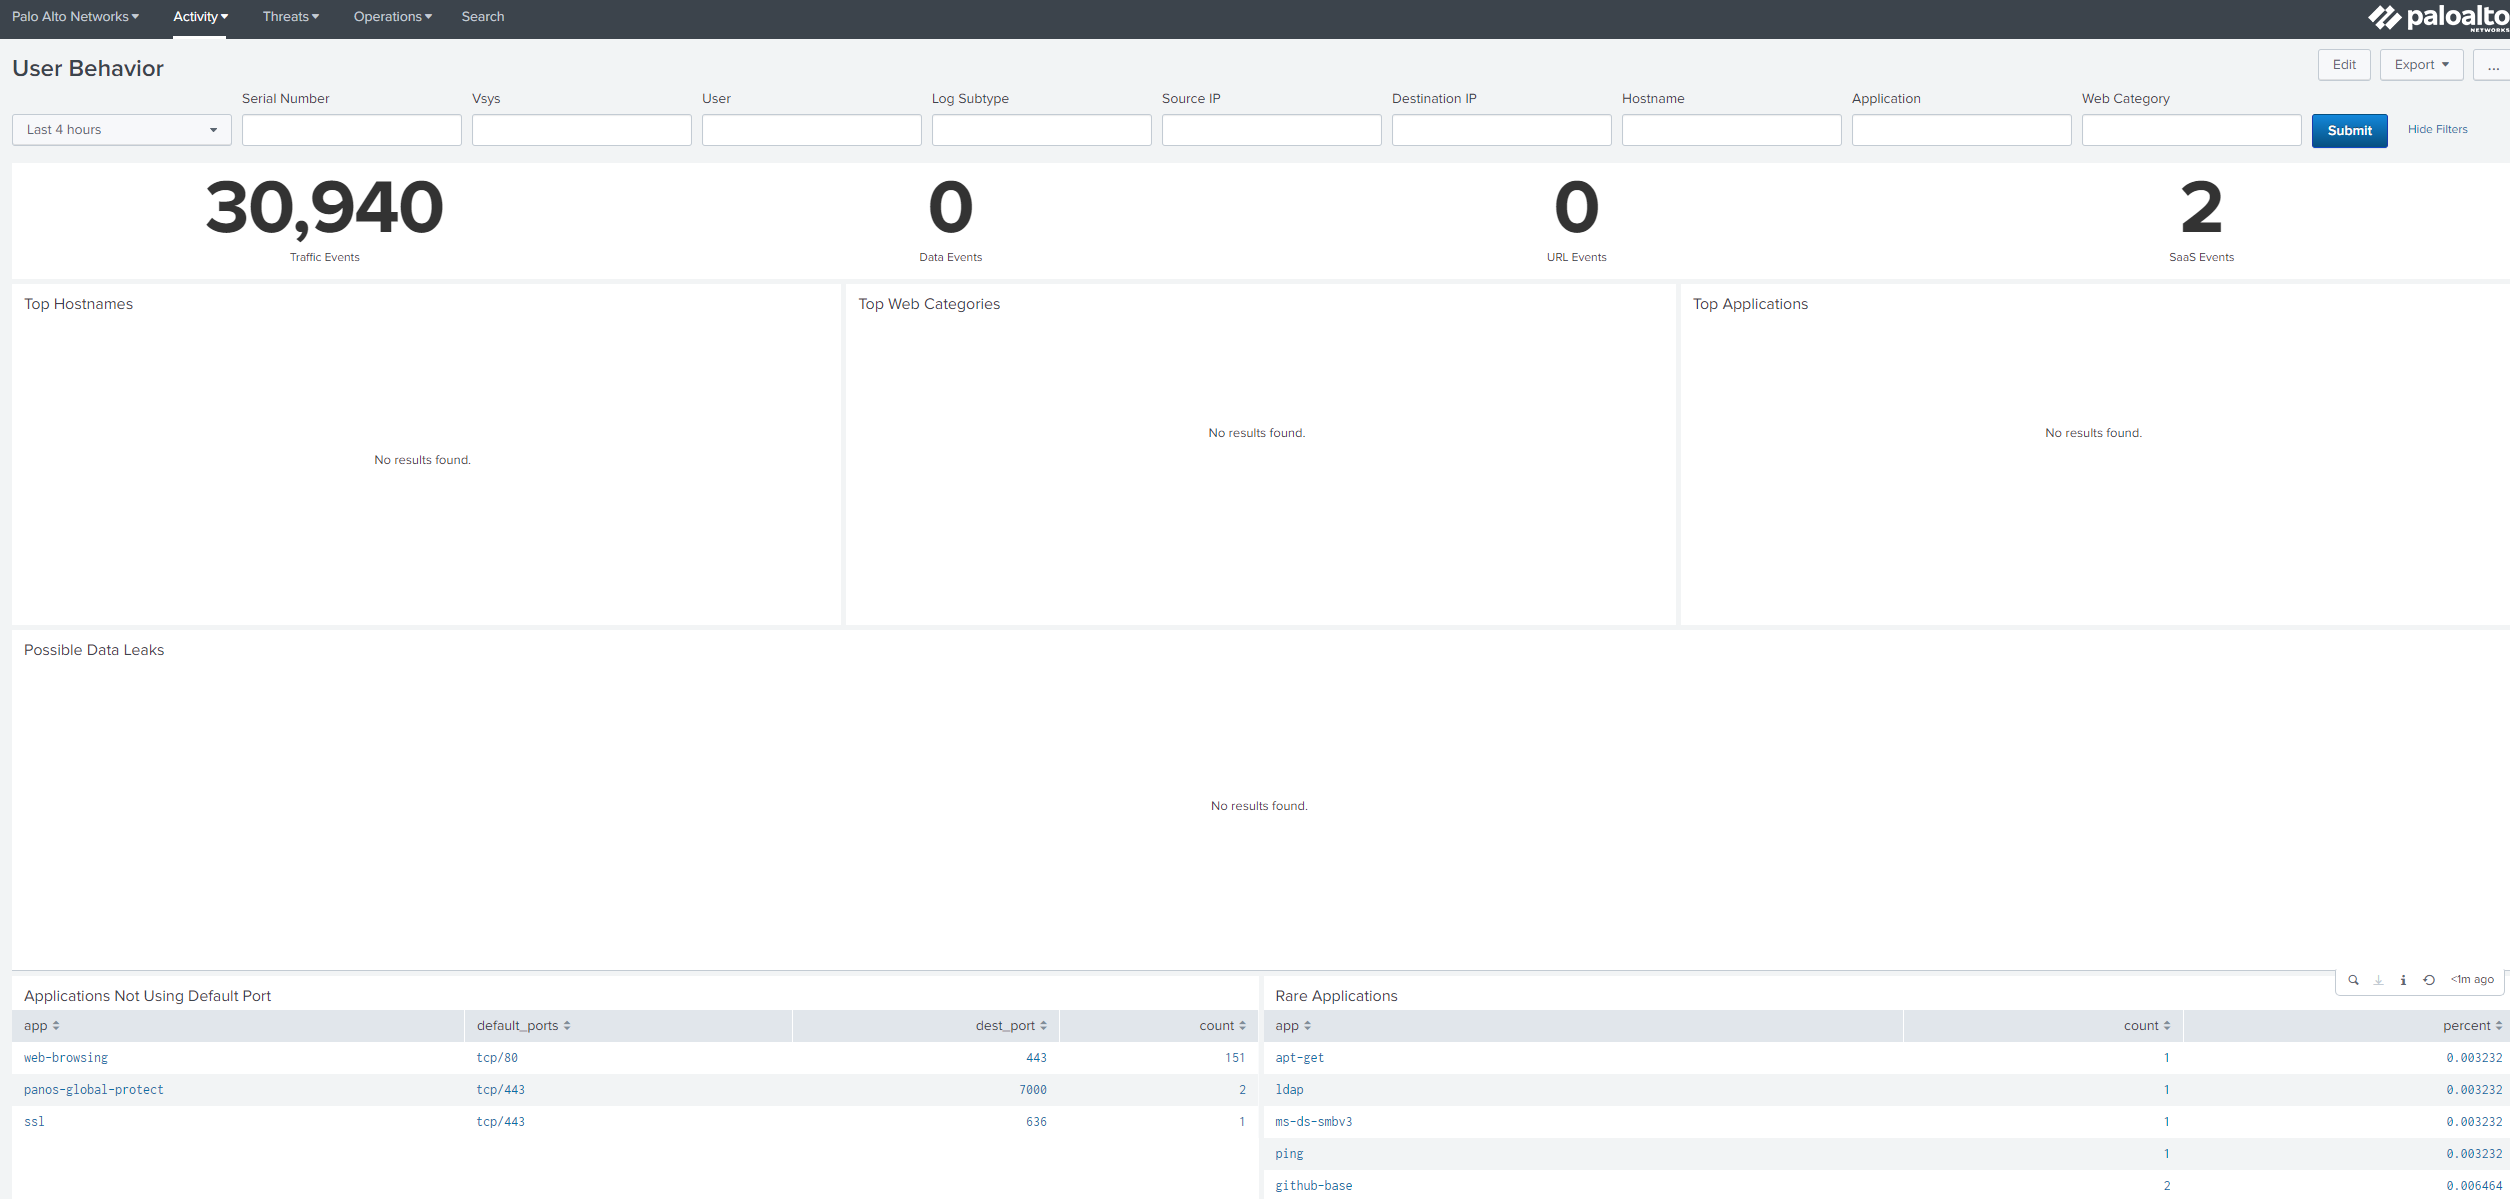
Splunk is a log aggregator and analyzer collecting logs from different sources to present those in a dashboard fashion for visibility. Inspecting traffic logs on a daily basis is a complete chore, especially if there’s over 1000 logs or more. Splunk simplifies this by offering you a dashboard, such as incidents, user behavior, GlobalProtect connected users, File Activity and even the applications that were used.
It has support for quite a range of products; Palo Alto Networks, Check Point, FortiGate, Office 365, etc. The web interface is clean and adding a new application isn’t that hard, but feeding them with logs does require some configuration. The firewall should forward logs to Splunk and a Data Input on Splunk should be added to complete the configuration.
Prerequisites
- Account at splunk.com is required to add apps
- The free license is plenty for a home lab but doesn’t support acceleration
- Windows Server or linux based system as a host for Splunk
- Palo Alto Networks Firewall
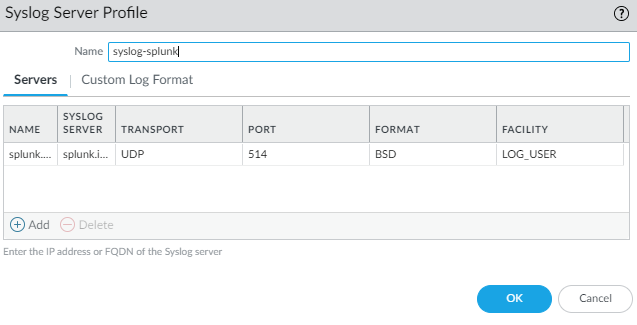
Configure Log Forwarding and a Syslog Server Profile
Device > Server Profiles > Syslog
Add the IP or FQDN of your Splunk server. FQDN won’t work unless you have a service route for DNS pointing to a Domain Controller. Leave everything at the default settings.
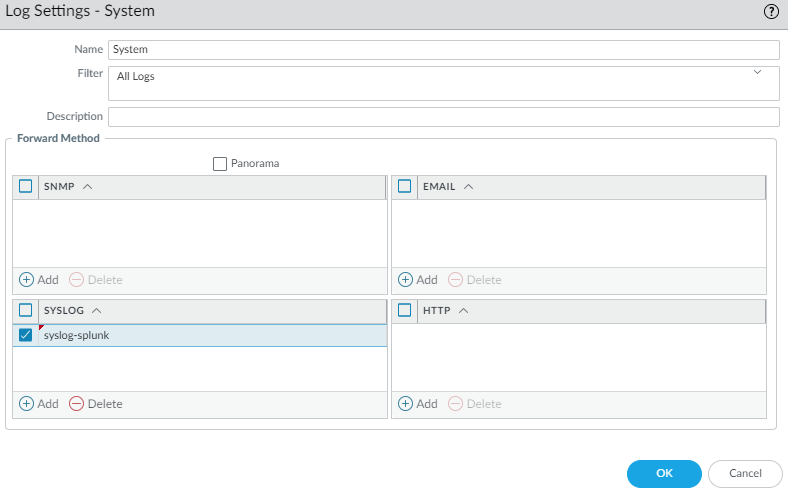
Device > Log Settings
To forward logs like GlobalProtect, system, configuration (firewall changes), User-ID etc we’ll need to specify a Syslog profile. Use the syslog server profile we created earlier.
Repeat the same for everything else, GlobalProtect, User-ID, configuration and so on.
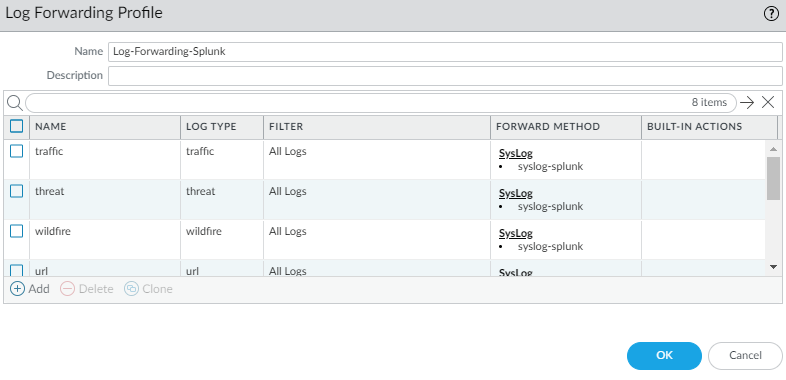
Next we have to tell the firewall to also forward logs such as traffic, decryption, threat, url to the syslog server.
Objects > Log Forwarding
Include all of them.
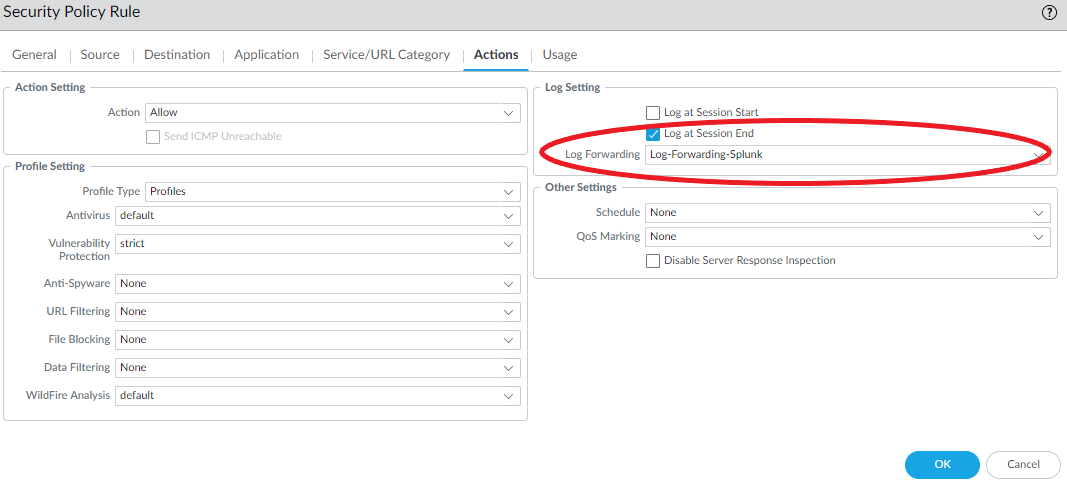
All of your security policies should be configured with log forwarding so that Splunk can receive them as well. Specify the syslog server profile. Do not forget to configure the intrazone & interzone policies as well.
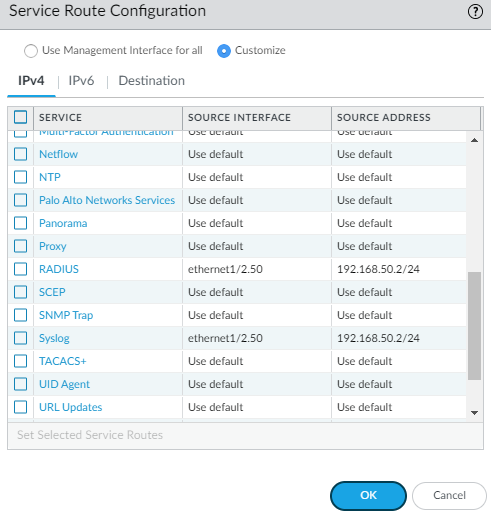
By default the firewall will use the management interface for all of its service routes, so specify the interface that’s part of the subnet the Splunk server participates.
Windows
The installation on Windows is pretty straight forward, so I won’t be covering it. Access the webserver by browsing to http://<ip-address>:8000. By default it does not support HTTPS but you can enable it under Settings > Server Settings > General Settings and make sure to change the port from 8000 to 443.
CentOS/RHEL 8 (.RPM)
We need the EPEL repository in order to install some packages.
yum info epel-release
yum install epel-release
yum config-manager --set-enabled PowerTools
If you receive an error like below:
No such command: config-manager. Please use /usr/bin/yum –help
Install the config-manager package:
yum install 'dnf-command(config-manager)'And run the command again:
yum config-manager --set-enabled PowerToolsFinally, update it:
yum updateTo view the repository list:
yum repolistWe do have to uninstall rsyslog as per Splunk’s recommendations. And we need to install syslog-ng.
rpm -e --nodeps rsyslog
yum install syslog-ng
systemctl start syslog-ng
Now we’ll actually start installing Splunk. So get the package from Splunk. They should of provided you with a WGET link after you’ve logged in. Make sure to use the .rpm package for CentOS or RHEL.
wget https://wget-link-splunk-providedMake sure the permissions are set to 644 before unpacking it.
chmod 644 splunk_package_name.rpm
rpm -i splunk_package_name.rpm
The default path is /opt/splunk and to start Splunk we have to enter the /opt/splunk/bin directory.
cd /opt/splunk/bin
./splunk start
./splunk enable boot-start
systemctl start splunk
Access the webserver by browsing to http://<ip-address>:8000 (https is turned off by default).
Make sure to turn off SELinux or else Splunk won’t accept any logs sent by the firewall. By default it’s set to enforcing, change it to disabled.
vi /etc/sysconfig/selinux
SELINUX=disabled
Splunk Configuration
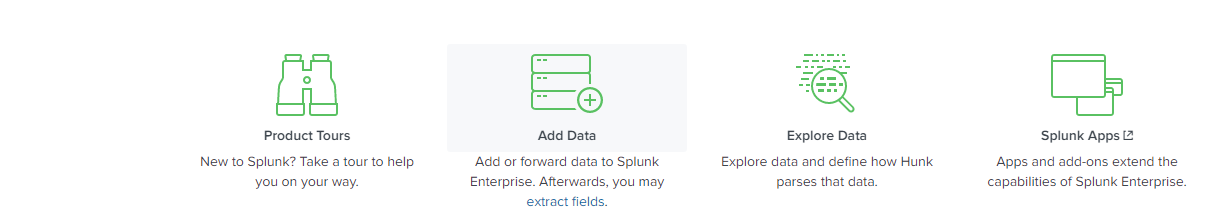
On the main page, select “Add Data”.
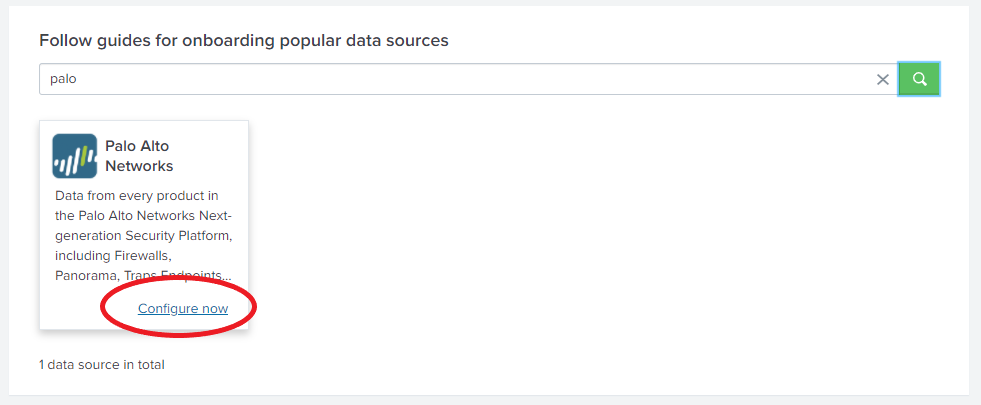
Search for Palo Alto Networks and click “configure now”.
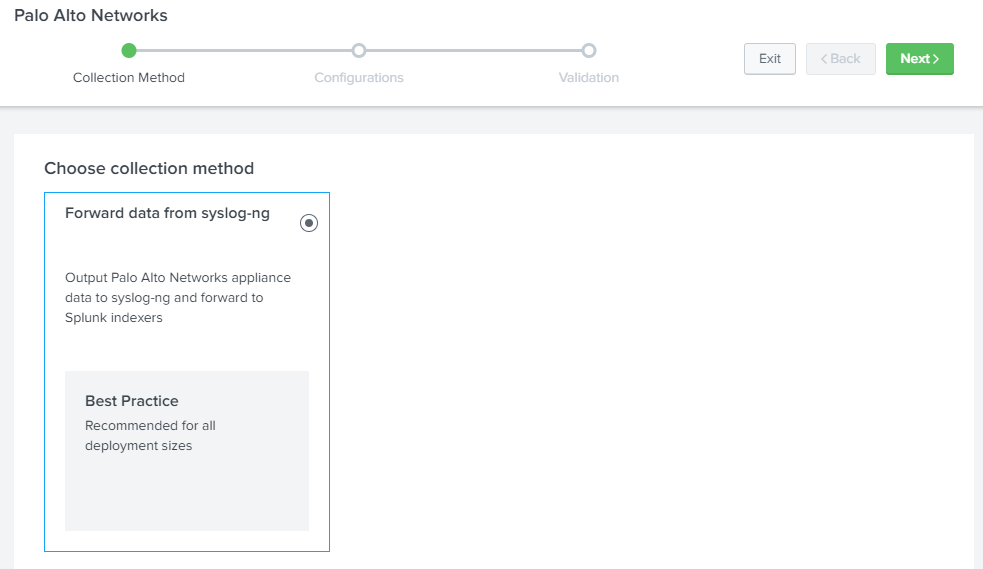
Click next.
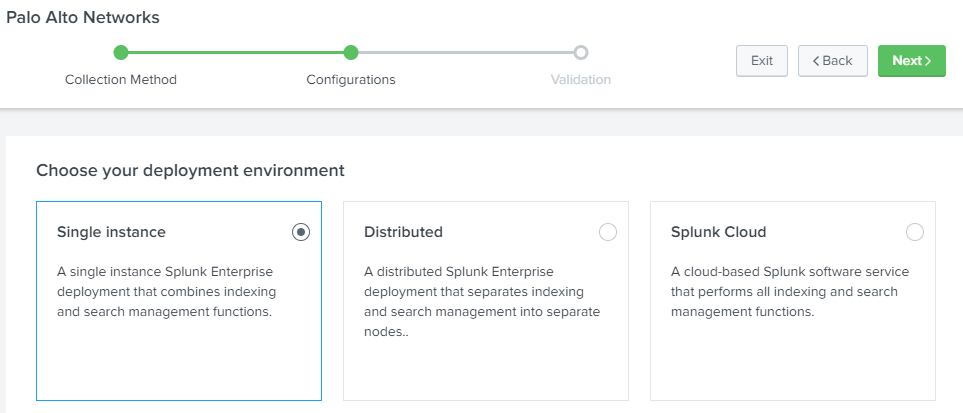
Select “Single-Instance” and click next.
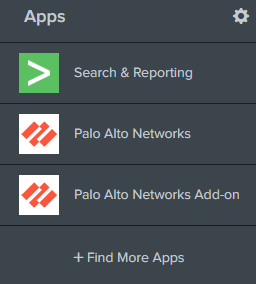
Add the following apps: Palo Alto Networks and Palo Alto Networks Add-On.
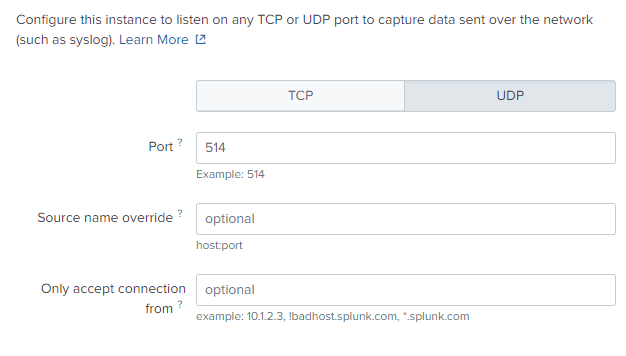
Add a new Data Input. Settings > Data Input
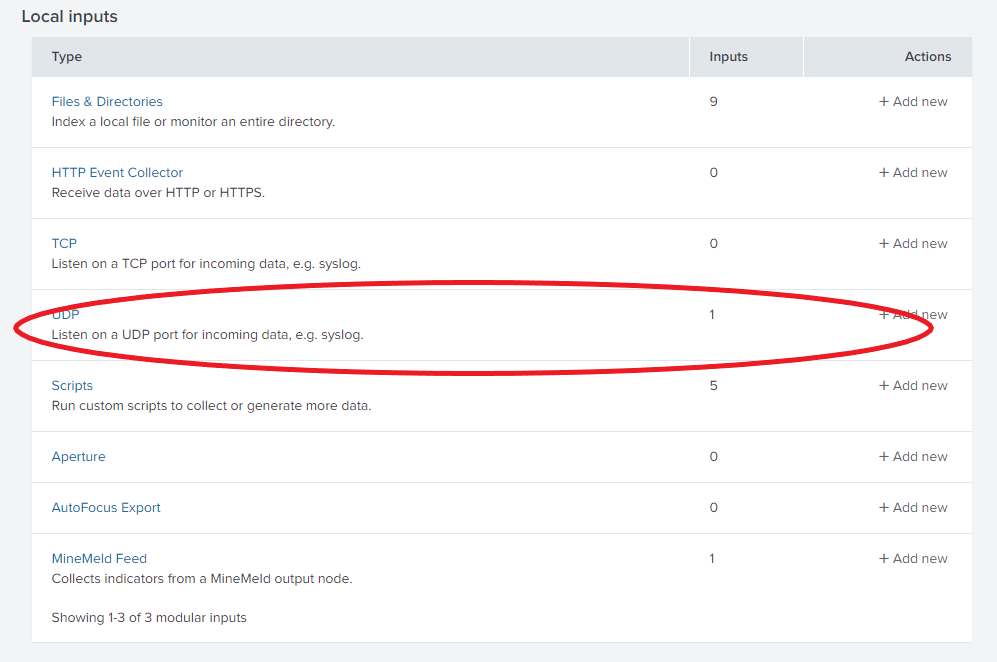
We’ll stick to UDP/514 since that’s how our syslog server profile is configured.
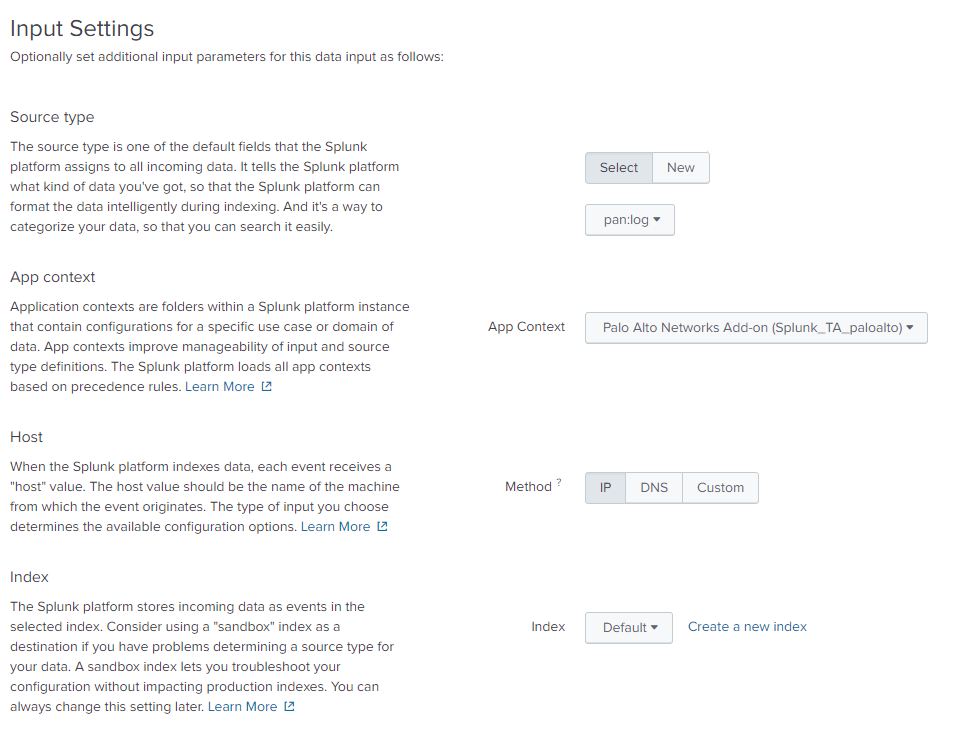
- Select pan:log as the source.
- Select Palo Alto Networks Add-On (Splunk_TA_paloalto) as the App context
Everything else should be left at the defaults.
Conclusion
It should like this if you browse to the Palo Alto Networks app.